If, last year, someone predicted that millions of people around the world would be told to leave their offices and work from home for the foreseeable future, I suspect that most of those people would have found the prospect unbelievable. But the COVID-19 pandemic and the subsequent global lockdown have made the unbelievable a reality; in fact, it’s the biggest experiment in working from home the world has ever seen. When almost everything and everyone was locked down, many companies had to quickly make other changes in how they operated, to adapt to a sudden “new normal” that’s unlikely to return to the old normal anytime soon -- if ever.
But here at the SoundStage! Network, the pandemic has changed little about where and how we work. All SoundStage! writers and editors have always worked from home, and the lockdowns have yet to affect our publication schedule -- because equipment is still delivered around the world with little delay, our writers have had no trouble getting goods in and reviews out.
What has changed with the lockdowns are our web-traffic figures, which have gone way up -- not only for our websites, but also for our Instagram, Facebook, and Twitter social-media pages and our YouTube channel. It makes obvious sense -- more people are stuck at home, in front of their computers. That across-the-board increases in readership and viewership has given us not only hope for the future, but the incentive to grow SoundStage! by making changes that will provide our visitors with additional content.
Our new normal
We had lots of ideas for new things to offer readers. Two were top priorities:
First and topmost was to create more videos to post on YouTube, to take advantage of the increasing numbers of audio enthusiasts who’ve turned to YouTube in the last few years to learn more about audio manufacturers and their products, rather than finding that information in print magazines or even on websites. We’ve created two new video series: SoundStage! Talks, launched May 12 and headed by editor-in-chief Jeff Fritz; and SoundStage! Take 2, which began on June 5 and for which we recruited YouTuber Jay Lee as reviewer and host. Talks focuses on interviews with representatives from audio companies around the globe; Take 2 features follow-up video reviews of products we’ve written about on our websites. To date, both new series have been successful.
Our other top priority for new content is the subject of this article: to provide even more measurements of the electronics products we review, to complement our reviewers’ listening impressions. Providing an abundance of measurements is not new for the SoundStage! Network. We began measuring loudspeakers in the anechoic chamber of Canada’s National Research Council (NRC) 20 years ago, and we’ve been measuring power amplifiers and preamplifiers almost as long, through the services of Bascom King’s BHK Labs.
However, it’s our speaker measurements that have gained more traction, for a couple of reasons. One is the high quality of the NRC’s testing facility, which gives readers the assurance that the measurements we produce there are accurate and meaningful.
The other reason is that we measure more of the speakers we review than we do the electronics we review, mostly because the NRC is only two miles from my home in Ottawa, Ontario, here in Canada. BHK Labs is in California, nowhere near me or any of our US-based team. That means high shipping costs, and a high risk of damage to the components to be measured. What to do?
Answer: Audio Precision
The solution to the distance problem was simple but costly: Buy the necessary test gear and install it nearby. Currently, the gold standard for testing hi-fi electronics is Audio Precision’s APx555 B Series audio analyzer. It costs about $30,000 USD, which is nearly $40,000 Canadian. Nonetheless, we bought one.
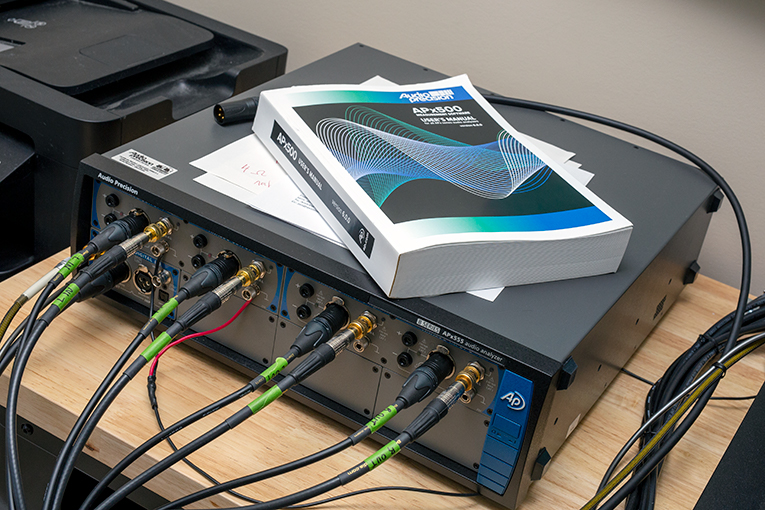 Audio Precision APx555 B Series
The APx555 B Series is the most sophisticated, highest-resolution audio analyzer now on the market. Its feature set and software, which runs on a separate computer, make possible thorough testing of preamplifiers, power amplifiers, integrated amplifiers, phono stages, digital-to-analog and analog-to-digital converters, and more. As far as I know, we are the only hi-fi publication in the world to own an APx555 B.
We also had to buy an abundance of high-quality interconnects, as well as eight 250W, 1%-tolerance, 4-ohm Vishay Dale load resistors, which we mounted on an aluminum plate that also acts as a heatsink, to test power amplifiers of up to 1000W output. That set us back another three grand.
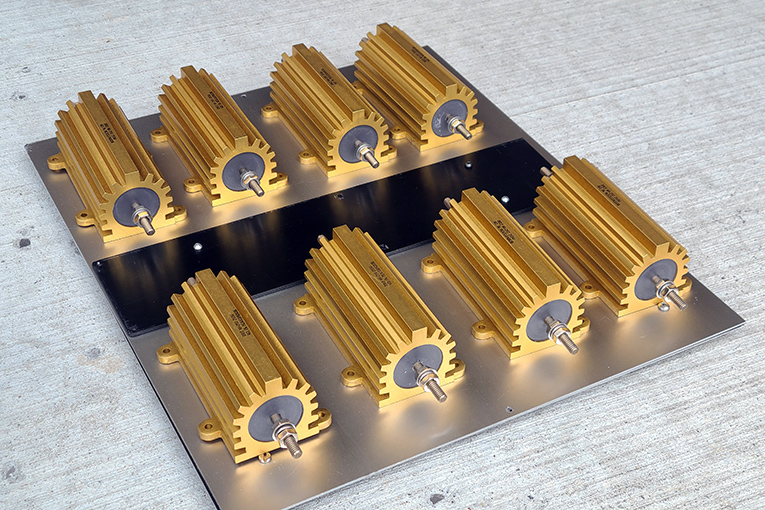 Vishay Dale resistors
To make the testing as convenient as it is at the NRC, reviewer Diego Estan, who’s now in charge of testing electronics for us, set up a lab in his home for the APx555 B and the associated test paraphernalia. He doesn’t live quite as close to the NRC as I do, but he’s not that far away -- about 12 miles.
Diego has a background in electronics and was already familiar with testing audio gear when the Audio Precision arrived, in August -- but he needs to learn more from the APx555 B’s 800-page manual before he’ll be able to take full advantage of it and its software. Diego is jazzed about it all -- for him, measuring hi-fi gear comes second only to listening to it. Within a couple of hours of receiving the APx555 B, he was running tests on his own components, and beginning to establish a standardized set of detailed measurements for each product type. That way, we can publish a wealth of precise data about each product tested, and it will be easier for us and for readers to compare the test results of various models within a given product type.
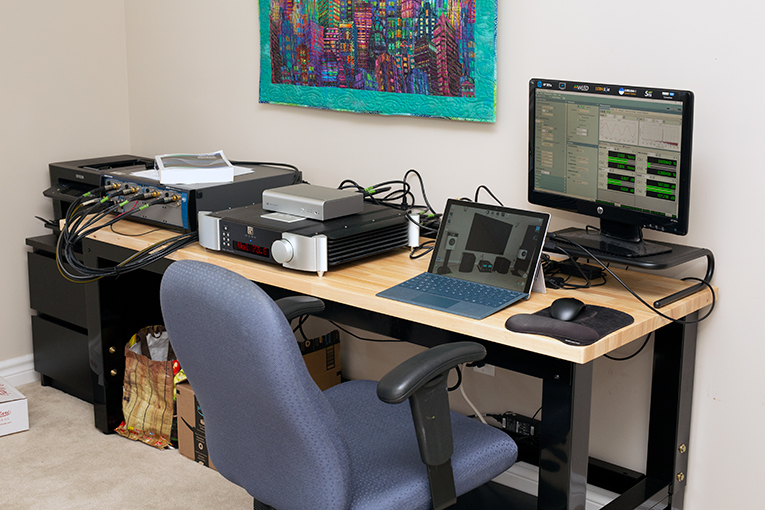 The lab
Protocols
Measuring electronic components can be pretty straightforward -- many of the tests are well established and already built into the AP’s software -- but determining the measurement protocol for each product type is time consuming. Not only do we have to select the tests we’ll perform on each unit, we also have to validate our results by comparing them with others’ tests, to ensure that we present accurate and meaningful data. This means that we’re not yet ready to subject current review products to the full battery of tests and publish the results. But in mid-September, as I write this, and for the reasons outlined below, I’m confident we’ll soon be able to test preamplifiers, and begin publishing the results as early as November 1. Phono stages will follow shortly after, then power and integrated amplifiers, then DACs. Our goal is to have the measurement protocols for all product types set in stone by January 1, 2021, and to publish full suites of measurements adhering to those protocols from that date forward.
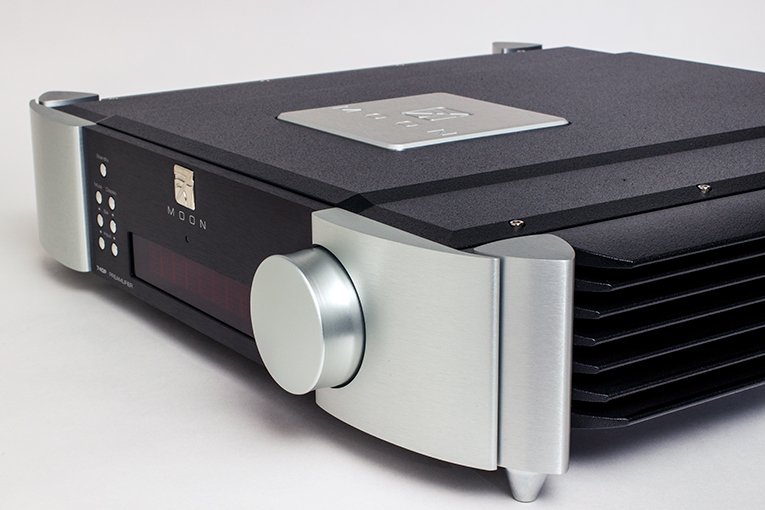 Simaudio Moon 740P
We were able to tackle preamplifiers first because we had a few of them around to test and then verify those test results. One was Simaudio’s Moon 740P preamplifier, which I reviewed in 2013 and still use. I’ve always considered it a top-drawer preamp in terms of its low noise, and thus its transparency to the music signals passed through it. I also feel that its volume control is among the best anywhere: Its left/right channel balance has always sounded ideal to me, with center images always locked solidly in place on the soundstage. It also offers volume increments and decrements as fine as 0.1dB, which means I can always get precisely the volume level I want. And when I turn the knob, it’s weight, size, and shape feel just right.
High shipping charges meant that we never had the Moon 740P tested by BHK Labs, so we had nothing to compare our new measurements with. But we worked with the engineers at Simaudio to validate our measurements with theirs, which made it an ideal guinea pig to begin with.
For now . . .
In this article I also want to familiarize readers with what our preamplifier measurements should look like, to give you an idea of the kind of detail you can expect to see accompanying our reviews as of January 1. I asked Diego to produce a full suite of measurements of the Simaudio Moon 740P with the protocols we have in place now, which probably will change little from now on, other than tweaks in formatting how the data are presented. What he came up with is displayed below.
As you read the measurements, note the comments Diego has provided about them, including how they compare to Simaudio’s published specifications and/or with those of similar products we’ve measured -- something we plan to provide in all future reviews. It’s our way of keeping manufacturers honest -- if no one fact-checks their claims, they’re free to say pretty much anything they want.
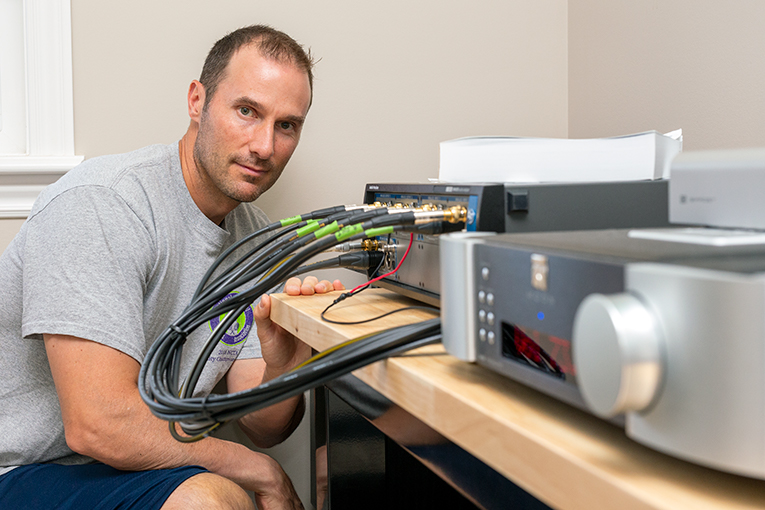 Diego measuring the Simaudio Moon 740P preamplifier
What Diego doesn’t attempt to do with these measurements -- nor will he in future -- is correlate them with what was heard in the listening sessions for the product reviewed. Although some audio publications try to marry measurements with listening impressions, we don’t feel that’s the right thing to do -- it potentially gives readers bad information. As we’ve found out in the 25 years we’ve been publishing, although there’s broad consensus in the engineering and scientific communities about which measurements are valuable, how that measuring should be performed, and what good and bad measurement outcomes look like in terms of well-engineered, technically proficient products, there’s little consensus about how that translates to what we hear, especially when the differences in measured performance are minute. Therefore, we’d rather let the listening impressions and the measurements speak for themselves, directly to our readers, without trying to mix the two.
We can’t promise that our measurements won’t be daunting to those unfamiliar with making sense of such things. To make use of our graphs and comments, you’ll need a basic knowledge of audio electronics. But we want to help -- Diego is also producing a glossary of terms that readers can click to in order to better understand the terms used in measuring audio gear. And if you have questions about the measurements now, or suggestions of things you’d like us to do in this regard, contact Diego at diego@soundstage.com.
Our goal for our new measurement process is to provide readers with more valuable information while minimizing misinformation. It’s a big, expensive, time-consuming step for the SoundStage! group, one we believe is well worth taking. We hope you agree.
. . . Doug Schneider
das@soundstage.com
Simaudio Moon 740P preamplifier: Measurements
General information
In learning to assess any preamplifier, understanding the operation of its volume control is important. Simaudio’s Moon 740P has a high-precision, digitally controlled, analog volume control comprising relays and a resistor-ladder network. Its volume range is 0.0 to 80.0dB, in increments of 1dB from 0.0 to 30.0dB, and of 0.1dB from 30.0 to 80.0dB -- a total of 530 discrete volume levels. I measured unity gain from the Moon 740P with its volume set to the 73.8dB position. Measurements of the volume control’s tracking can be seen in the table below. There’s an impressive maximum left/right deviation of 0.025dB at the lowest volume setting. For the remainder of the range, the tracking never deviated by more than an imperceptible 0.02dB.
Of note in the operation of the device under test (DUT) is its user-adjustable gain. This function doesn’t alter the volume-control position for each input, but does vary the gain for that input. The default gain position is 6dB, which can be increased to 10dB. Unless otherwise specified, measurements were taken using the balanced inputs and outputs, at the default gain of 6dB and the volume control set to unity gain.
Volume-control accuracy: left/right channel tracking
Volume Position Left/right Channel Deviation
- 1.0dB 0.0252dB
- 5.0dB 0.0061dB
- 10.0dB 0.0033dB
- 30.0dB 0.0201dB
- 50.0dB 0.0134dB
- 70.0dB 0.0168dB
- 80.0dB 0.0181dB
Published specifications vs. our primary measurements
Simaudio Moon 740P: Published Specifications
- Gain: 9dB
- Signal/noise, 20Hz-20kHz: 120dB at full output
- Crosstalk at 1kHz: -116dB
- Output impedance: 50 ohms
- Total harmonic distortion (THD), 20Hz-20kHz: 0.001%
- Intermodulation distortion: 0.0003%
- Frequency response (full-range): 5Hz-100kHz, ±0.1dB
Our primary measurements revealed the following:
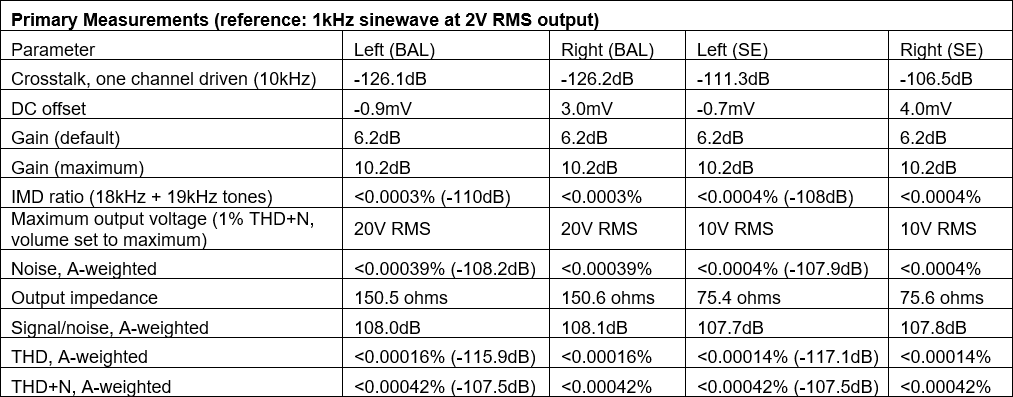
We don’t know if Simaudio’s published specs are for balanced or single-ended connection, but given the fact that the Moon 740P’s circuitry is fully balanced, we assume that they refer to balanced connection. Given that, we found no significant or adverse discrepancies between our measurements and Simaudio’s.
We measured a maximum gain of 10.2dB, vs. Simaudio’s specified 9dB. The signal/noise ratios (SNRs) were difficult to compare because it’s unclear what Simaudio means by “full output.” Our measurement of 108dB was based on a standard reference output voltage for preamps of 2V RMS (A-weighted), even though the Moon 740P is capable of much more output. If we measure the 740P’s SNR with 10V RMS at the output, unweighted, but with a 10Hz-22.4kHz bandwidth filter (Simaudio specifies 20Hz-20kHz), we get a SNR of 120dB, which does match Simaudio’s spec.
Simaudio’s spec of 50 ohms output impedance differs from our measurement of 75 ohms single-ended (150 ohms balanced). This discrepancy is of no consequence for any typical combination of preamplifier and power amplifier.
Our crosstalk measurement of -126dB, taken at 10kHz, betters Simaudio’s specified -116dB at 1kHz. When we measured the crosstalk at 1kHz, the results were the same: -126dB.
We confirmed Simaudio’s spec of 0.001% THD. While Sim doesn’t specify the reference output voltages and weighting, we measured THD of better than 0.00016% and THD+N of better than 0.00042%, both A-weighted -- in both instances, even lower than Simaudio’s specs. The Moon 740P’s claimed intermodulation distortion measurement, again not specified in terms of input frequencies, nonetheless matches our own, at better than 0.0003%.
Frequency response (1Hz-80kHz relative to 1kHz)
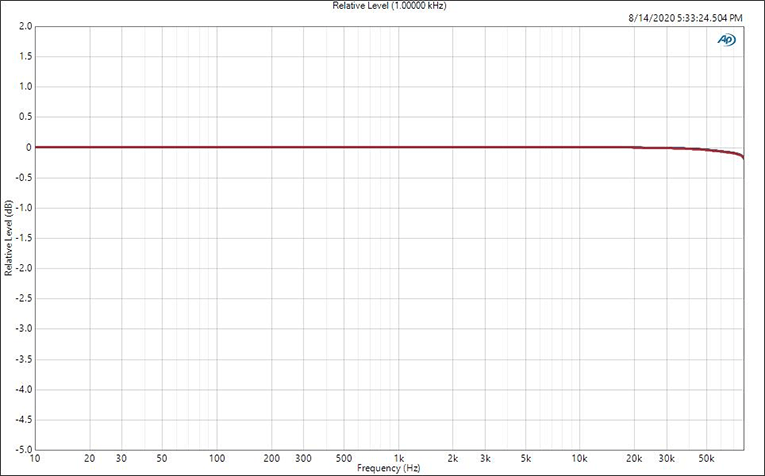
In our measured frequency-response plot (above), the Moon 740P’s is only -0.2dB at 80kHz. This does not quite confirm Simaudio’s claim of -0.1dB at 100kHz, but for audio applications at these frequencies, which are far above the upper limit of human hearing, this is splitting hairs. In the graph above and most of the graphs below, only a single trace is visible. This is because the left channel (blue trace) is performing identically to the right channel (red), and so their traces perfectly overlap, indicating that the two channels are ideally matched.
Phase response (20Hz-20kHz)
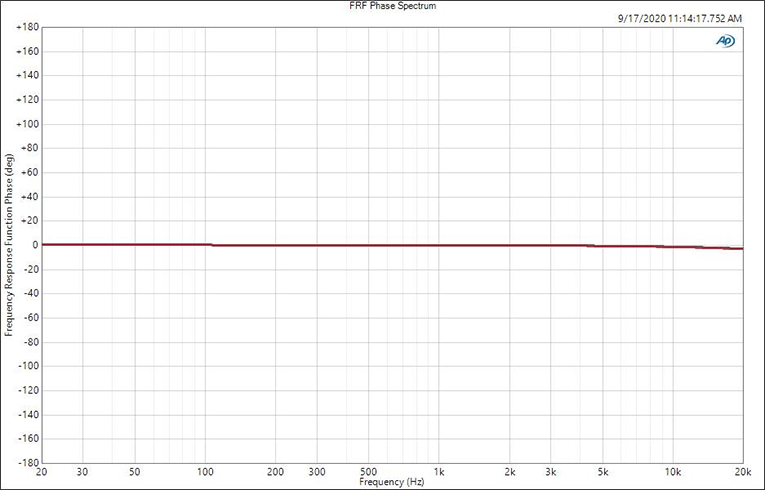
Shown above is the phase response of the Moon 740P from 20Hz to 20kHz. The plot is clean, with only -3° of phase shift at 20kHz -- an extremely small amount.
THD+N ratio (A-weighted) vs. frequency into 200k ohms (left/right channels = blue/red) and 600 ohms (left/right channels = purple/green)
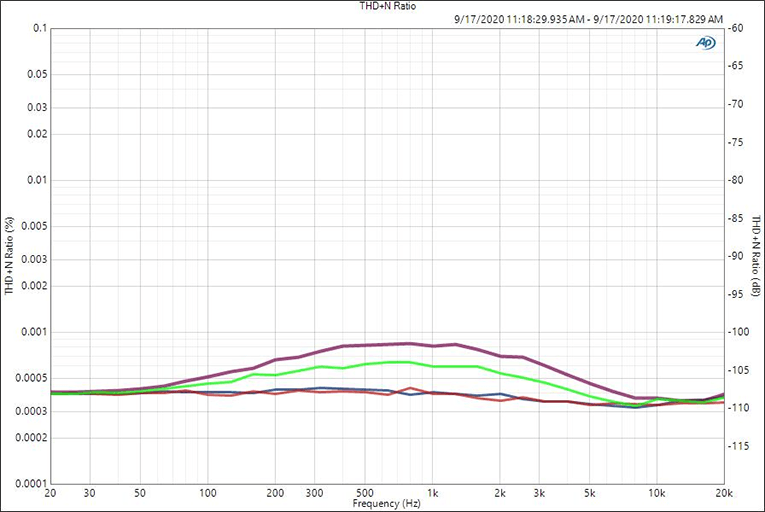
Above is a plot of the Moon 740P’s THD+N as a function of frequency, for loads of 200k ohms and 600 ohms. We can see very low values of THD+N, ranging from 0.0004% to 0.0003% for the typical 200k ohm load, and a worst-case 0.008% from 500Hz to 1kHz into the more challenging 600-ohm load.
THD+N ratio (A-weighted) vs. output voltage (1mV RMS to 15V RMS input sweep)
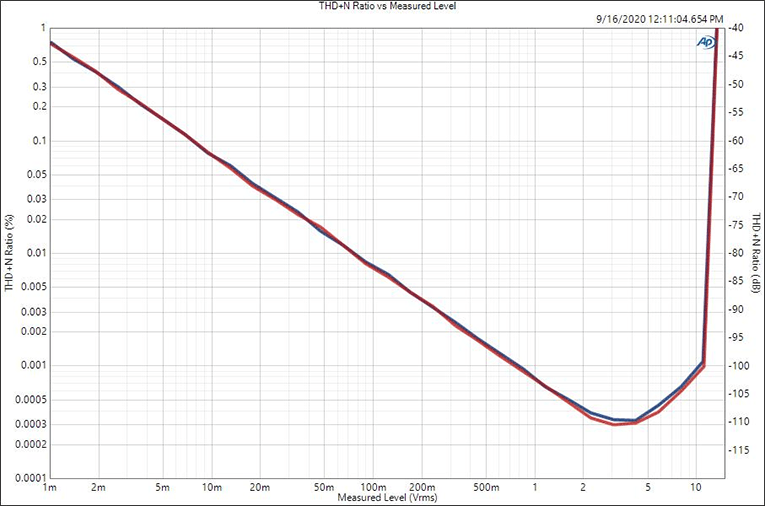
Above is a plot of the Moon 740P’s THD+N as a function of output voltage. The THD+N is very low, ranging from 0.05% to 0.0003% from about 1mV RMS to 4V RMS at the output. Beyond this output voltage, the DUT’s distortion rises exponentially, reaching 1% THD+N at about 13V RMS at the output.
FFT Spectrum (1kHz at 2V RMS)
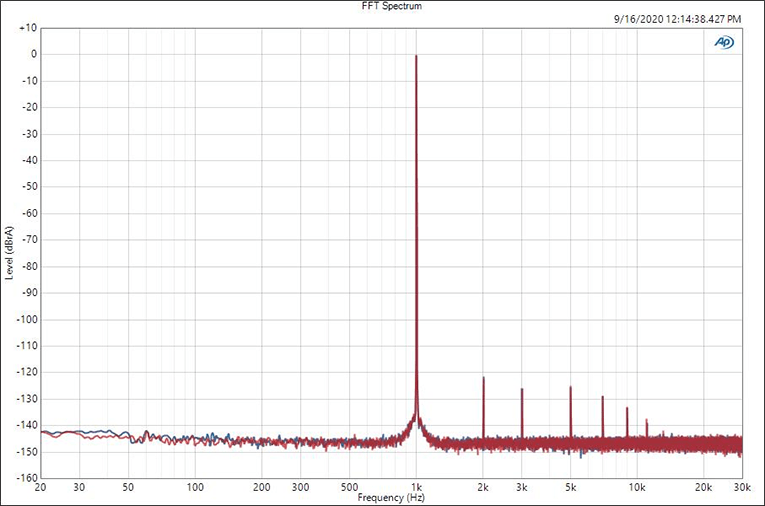
Shown above is a fast Fourier transform (FFT) of a 1kHz, 2V RMS input sinewave stimulus, which results in the reference output voltage of 2V RMS with the gain set to unity. Here we see that the second harmonic, at 2kHz, is just below -120dBrA (relative to the reference 0dB signal). The other harmonics range from about -125dBrA to -138dBrA (i.e., about 0.00006 to 0.00001%). Of note is how clean the FFT is below 1kHz, with no trace of the peak at 60 or 120Hz (50 or 100Hz in Europe and other parts of the world) that can be seen in other devices, and is caused by power-supply noise/ripple.
Intermodulation distortion FFT (18kHz + 19kHz summed stimulus)
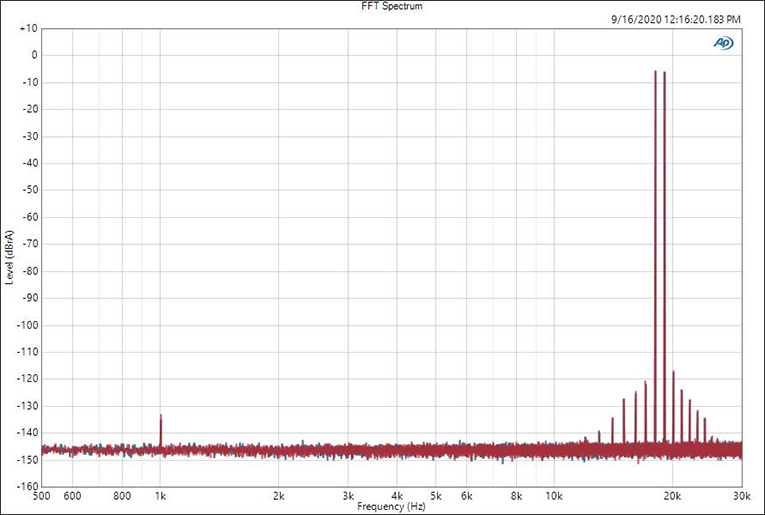
Above is an FFT of the intermodulation (IMD) products for an 18kHz + 19kHz summed sinewave stimulus tone. The input RMS values are set at -6.02dBrA so that, if summed for a mean frequency of 18.5kHz, they would yield 2V RMS (0dBrA) at the output. Here we find that the second-order modulation product (i.e., the difference signal of 1kHz) is below -130dBrA, while the third-order modulation products, 17kHz and 20kHz, are respectively just below and just above -120dBrA.
Squarewave response (10kHz at 5Vpp)
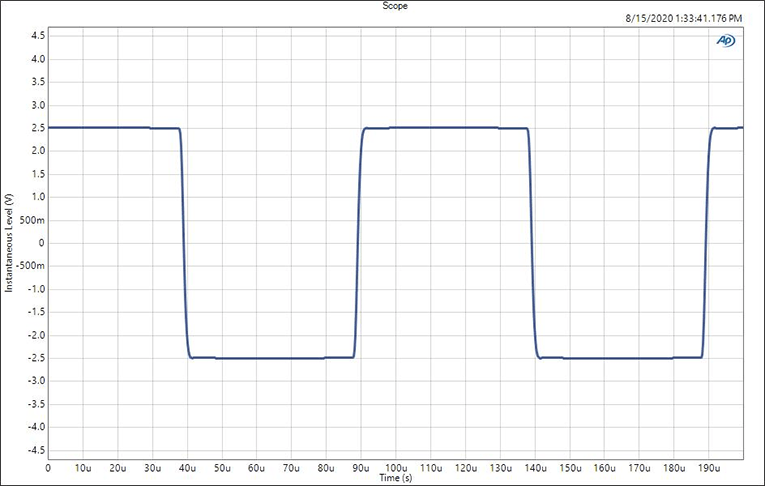
Last is the 10kHz squarewave response of the Moon 740P. Due to limitations inherent to the Audio Precision APx555 B Series analyzer, this graph should not be used to infer or extrapolate the 740P’s slew-rate performance. Rather, it should be seen as a qualitative representation of the DUT’s extended bandwidth. An ideal squarewave can be represented as the sum of a sinewave and an infinite series of its odd-order harmonics (e.g., 10kHz + 30kHz + 50kHz + 70kHz . . .). A limited bandwidth will show only the sum of the lower-order harmonics, resulting in noticeable undershoot and/or overshoot. The Moon 740P’s reproduction of the 10kHz squarewave is textbook clean, with square edges devoid of undershoot and overshoot.
. . . Diego Estan
diego@soundstage.com


