Sample rate
The sample rate of a system expresses how often the value of the analog signal is recorded. This value is nearly always given in samples per second, or hertz (Hz). Common sampling rates used in audio today are: 44.1kHz, 48kHz, 88.2kHz, 96kHz, 176.4kHz, and 192kHz. Faster PCM sample rates exist, but their use in audio applications is still limited. The sample rate indicates how closely the digital converter can track the amplitude of the signal with respect to time. If the signal doesn’t change smoothly between samples, the converter will not be able to track that behavior. Theoretically, there are only two downsides to using very high sample rates: a signal sampled at a higher rate requires more storage space than one sampled at a lower rate, and the computing power required to manipulate the signal in any way grows in proportion to the sample rate. In the real world, analog-to-digital converters that run at very high sample rates can have other limitations.
Most readers will be familiar with, or at least will have heard of, the Nyquist Rate. The Nyquist-Shannon Sampling Theorem states that a periodic, band-limited signal that extends infinitely over time can be completely determined, and therefore reconstructed, by sampling it at twice the frequency of its highest frequency component. For example, a 20kHz signal can be reconstructed so long as it is sampled at 40kHz or faster. After a little consideration, this theorem seems pretty obvious -- so obvious, in fact, that it was independently developed by half a dozen other people. The theorem, as originally proposed by Shannon, has one minor flaw: A frequency component at exactly half the sampling rate cannot be determined if it is placed 90 degrees out of phase with the sampling clock. Later restatements of the theorem require a sampling rate that is more than twice the highest frequency of the signal, which solves this problem. When the conditions of a band-limited signal and infinite time are ignored, it becomes easy to misunderstand and misapply the theorem. However, that does not represent a problem with or a criticism of the theorem itself.
Consider the Compact Disc’s sampling rate of 44.1kHz: The highest frequency that can be represented on a CD is 22,050Hz. At first glance, this looks sufficient; the number most often given for the upper limit of human hearing is 20,000Hz, or 20kHz. But is that really the upper limit? There is growing evidence that humans can actually perceive frequencies in excess of 20kHz, though these frequencies may not be consciously perceived as sound. For example, researchers in Japan have tested a type of hearing aid that uses bone conduction at a frequency of 30kHz to convey some information about the inflection of speech -- the mood of the speaker, not the content of the words. The control group for that experiment -- people with normal hearing -- listen to the same 30kHz signal through headphones, with similar results. The intermodulations of ultrasonic frequencies with each other and with lower, frequencies can and do produce other frequencies well within the audioband.
Most discussions that I’ve heard or read that advocate the use of higher sample rates in audio applications stop at that point. However, a number of other things that can happen to a signal when we sample it may be of equal or greater importance to the listening experience.
An analogy might aid our understanding of what it means to sample an audio signal. Imagine a bouncing ball. This ball is very special, because it has a coefficient of restitution equal to 1 -- that is, with each bounce, it returns to the height from which it was dropped. In order to make the numbers a little easier to understand, gravity in our hypothetical universe does not cause acceleration, so the ball drops and rebounds at a constant velocity. (Aristotle would approve.) Our bouncing ball has a period of 1 second. That means that from the time the ball is dropped through when it hits the ground and bounces back to its original position, one second has elapsed. In order to record the ball’s height, we will take a picture of the ball twice each second -- the Nyquist rate. When we take the first picture, the ball is in perfect phase with our snapping shutter. At time = 0 (an arbitrary distinction, as both the bouncing ball and the pictures extend infinitely in both directions and time), the ball is at height 1. When we take the next picture, at time equals 0.5 second, the ball has just hit the ground and is therefore at height 0. By the next picture, at time equals 1 second, the ball has returned to height 1. In this case, our sampling technique has perfectly captured the motion of the ball.
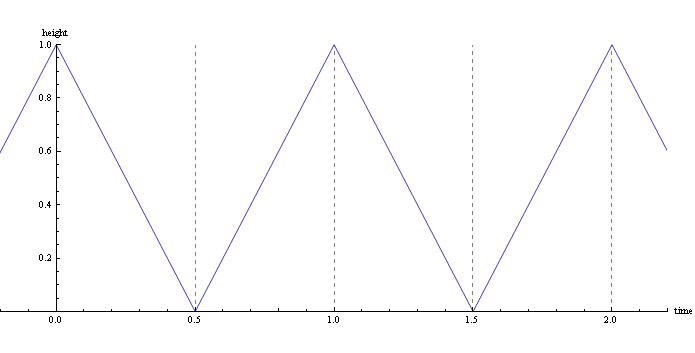
The blue line represents the height of the bouncing ball relative to time, which moves along the x axis. The dashed vertical lines indicate the instances at which a picture is taken.
Now, let’s change by just a little bit the motion of the ball relative to the taking of the pictures. In this instance, the ball will be at the top of its bounce at time equals 0.1 second, and hit the ground at time equals 0.6 second. Since the ball has been bouncing forever, our picture at time equals 0.0 will record the height of the ball at 0.8 -- when it is in its upward trajectory. Our next picture, at time equals 0.5 second, will record the height of the ball as 0.2. You can immediately see that there are two problems in our representation of the bouncing ball. The amplitude -- the difference between the maximum and minimum heights -- has been decreased by 40%, to only 0.6. As we continue to shift the motion of the ball relative to the pictures, the amplitude is further reduced, until the point at which the top of the bounce is exactly midway between pictures, when the recorded amplitude goes to 0. The phase of the bouncing ball -- the locations of its highest and lowest points of travel relative to time -- has also been changed. Remember that we know nothing about what happened between each pair of images. We can only assume that the ball’s motion perfectly aligns in time with our pictures, which means that in our reconstructed signal, the peak of the ball’s travel as well as its valley occur at exactly the times we took the pictures. So not only was the amplitude reduced, but the entire periodic motion of the ball has been shifted by 0.1 second, or 10%, or 18 degrees.
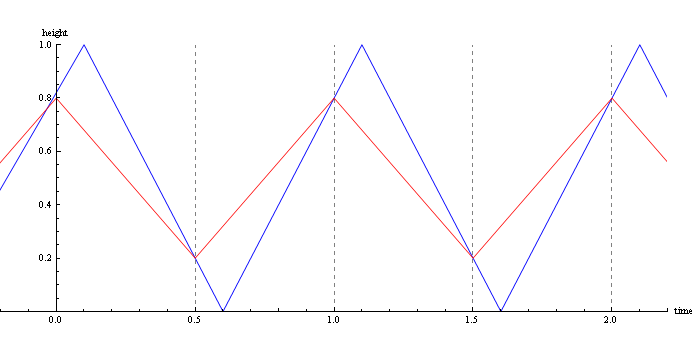
The blue line still represents the height of the ball and the dashed lines still indicate when the pictures were taken. The red line represents the height of the ball as it is reconstructed from our pictures.
Returning to audio, these variations in amplitude occur at frequencies that are too high to affect the balance between instruments and voices, but they will change the harmonic structures of particular sounds -- changing the prominence of upper harmonics depending on where they fall relative to the sample clock. The phase shift of a single frequency has no audible consequences, but different frequencies in a complex waveform will be shifted by different amounts. We can replace the bouncing ball with a 20kHz sinewave sampled at 40kHz, but we will still leave its phase offset by 10%. Now, let’s consider the 20kHz wave to be the third harmonic of a 5kHz sinewave; the first and second harmonics will lie at 10kHz and 15kHz, respectively. In the analog signal, all of these frequencies travel together -- when the 5kHz sinewave is at its maximum, so are the other three. In the reconstructed signal, the 5kHz wave will be shifted by 2.5%, the 10kHz wave by 5%, and the 15kHz wave by 6.67%. The resulting waveform, which is the summation of all of these frequencies, will not have the same shape as the original signal. Most research suggests that these phase distortions are not audible, but there is no question that the output signal is different from the input signal.
In the previous example, we met with problems even while obeying the conditions of the Nyquist-Shannon Sampling Theorem, but real-world signals don’t follow those constraints. The first condition of the theorem is that the signal must be band-limited. That means that it is not allowed to contain frequencies higher than half the sample rate. If it does, then a problem called aliasing occurs, wherein frequency components that are not part of the original signal are introduced into the representation and wreak havoc on the reconstruction -- these added frequencies are mathematically related to the sample rate. Whether we can hear them or not, an audio signal will contain some frequency components higher than 20kHz. In order to avoid aliasing, a filter must be employed before digital conversion that eliminates those higher frequencies. Because a perfect brick-wall filter -- a filter that completely eliminates all frequencies beyond a certain point but does not affect frequencies below that point -- cannot be realized, any filter will alter the signal in both amplitude and phase even before any conversion occurs. One advantage to using a sample rate of significantly more than twice the highest frequency of interest is that the corrupting effects of the filter will not be present in the critical frequency band. In the context of an audio signal, using a sample rate of 88.2kHz means that the filter will be doing its damage at around 40kHz, which is probably inaudible.
The ear-brain system is quite adept at identifying frequencies, but our auditory apparatus is not solely a spectrum analyzer. We are extremely sensitive to transient activity -- abrupt changes -- and the arrival times of sounds. Many researchers have tried to discover the time resolution of human hearing, and the accepted figure has gotten progressively smaller over the years as better experimental setups have been used. The most recent work by Dr. M.N. Kunchur, a physicist at the University of South Carolina, suggests that we can detect changes on timescales as small as 5 microseconds (5µs, or 0.000005 second). Approaching the problem from the perspective of audio fidelity, the best modern microphones are capable of responding to very fast transient signals. From the time the microphone begins to register the transient to the time the signal recrosses zero can be less than 10µs, and the rise from zero to the signal’s peak can be less than 5µs. In order to reliably capture an event that could occur over only a 5µs interval, the system must sample at 200kHz -- and if it is intended to accurately map the signal, it should actually sample much faster than that.
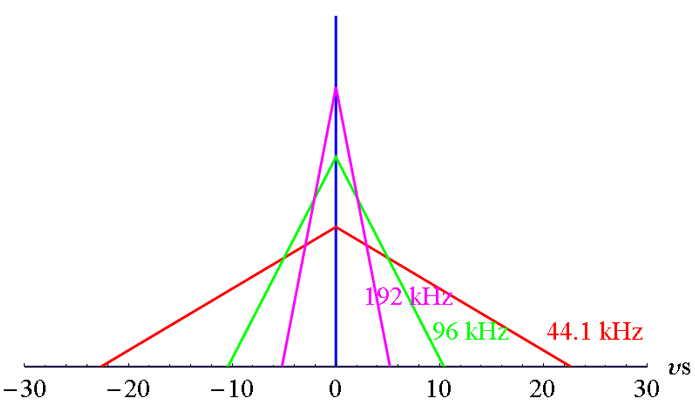
Engineers characterize how a system maps quick changes to the input signal by measuring its impulse response. Theoretically, an impulse is an instantaneous change in the state of the system. It is a signal that is equal to 1 at time = 0, and to 0 everywhere else. This signal has an infinite slope and contains infinite frequencies. In reality, such a signal is impossible to generate, so other methods are used to measure impulse response. When we consider what happens to this impulse in a sampled system, we are forced to make the assumption that the impulse occurs exactly when we are taking a sample -- otherwise, we would miss it completely. When we graph the result, at time = 0, we see a triangle centered at zero, whose base extends from the previous sample time to the next sample time. If we were to include all of the effects of a digital filter, the graph would be far messier -- showing both pre-ringing and post-ringing -- but one effect of reconstructing the signal reduces the amplitude of the impulse and, hence, the height of the triangle. Clearly, the faster we sample the signal, the closer we get to representing its true behavior.
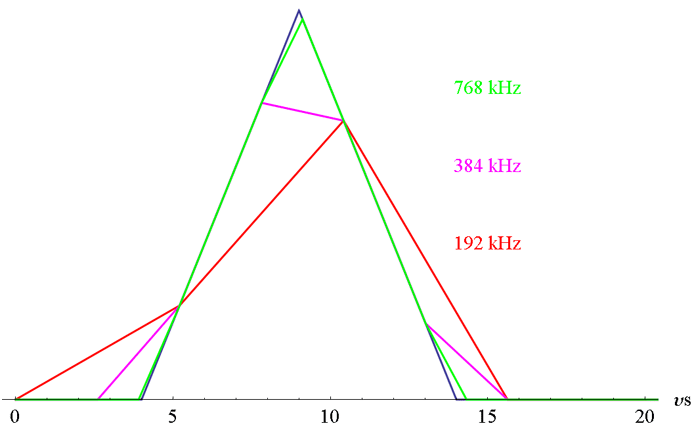
Instead of considering a perfect theoretical impulse, we can examine how a digital system would record the impulse generated by a microphone with good transient response. In the following figure, the electrical signal (in blue) begins at 4µs, peaks at 9µs, and returns to zero at 14µs. (For clarity’s sake, we won’t consider the settling of the microphone diaphragm.) As the sample rate is increased, the reconstructed signal more closely approximates the input. If a good reconstruction filter is applied, then the 384kHz-sampled signal will be very close to the input signal, with minimal artifacts. The 768kHz signal is already almost perfect, and needs only a low-pass filter to re-create an excellent approximation of the analog waveform.
Being able to accurately record fast changes has, principally, two consequences for music signals. Precisely locating the beginning of each note is not, on the order of these timescales, necessary for rhythmic considerations, but capturing the attack of each note is crucial for sonic realism. Research has shown that the unmusical sounds at the beginning of each note help us to identify which instrument is playing. Recording that instrument will inevitably smear that beginning transient, but better microphones and analog components can reduce such smearing. A slow sample rate does not cause smearing in the same way as does a microphone diaphragm or a slow electronic circuit, but it does discard potentially audible information about the transient.
High resolution in the time domain is also important for creating a truly holographic soundstage. I would have thought that 44.1kHz, which results in a spatial discrimination of less than 1cm, would be more than sufficient to accurately portray the positions of instruments and singers, but my experience has been that higher sample rates do a much better job in this regard. There is likely some other mechanism at work. If you’ve ever wondered why vinyl records can produce a more three-dimensional soundstage than CDs, the explanation may have something to do with their better time resolution; but a high enough sample rate can provide better time resolution than even the very best LP pressings.
As with bit depth, a higher sample rate is generally better than a lower one. For any signal, though, there will come a point at which its digital representation is, essentially, already perfect, and a further increase in the sample rate will provide no benefit.
. . . S. Andrea Sundaram
andreas@soundstagenetwork.com


